Below is the price distribution in Paphos districts for rent and sale of one—and two-bedroom apartments in buildings no older than constructed in 2019 (based on data available on September 14th, 2024). The rental yield is calculated as the average annual rent divided by the average sale price. The higher the percentage, the better the cash flow in this district.
| District | Min Sale 1bd | Avg Sale 1bd | Min Sale 2bd | Avg Sale 2bd | Min Rent 1bd | Avg Rent 1bd | Min Rent 2bd | Avg Rent 2bd | Rental Yield 1bd | Rental Yield 2bd |
|---|---|---|---|---|---|---|---|---|---|---|
| Anavargos | 0 | 0 | 0 | 0 | 0 | 0 | 1100 | 1250 | 0 | 0 |
| Aphrodite Hills | 0 | 0 | 495000 | 623636 | 0 | 0 | 2600 | 2733 | 0 | 5.26 |
| Chlorakas | 110000 | 200207 | 155300 | 298934 | 580 | 627 | 800 | 1028 | 3.76 | 4.13 |
| Empa | 159500 | 230711 | 159999 | 295850 | 0 | 0 | 0 | 0 | 0 | 0 |
| Geroskipou | 150000 | 210201 | 145000 | 311929 | 550 | 825 | 950 | 1422 | 4.71 | 5.47 |
| Kato Paphos | 110000 | 295517 | 210000 | 504553 | 0 | 0 | 850 | 982 | 0 | 2.34 |
| Kissonerga | 190000 | 215000 | 195000 | 296412 | 0 | 0 | 0 | 0 | 0 | 0 |
| Konia | 205000 | 207500 | 255000 | 275571 | 0 | 0 | 800 | 900 | 0 | 3.92 |
| Kouklia | 0 | 0 | 475000 | 523900 | 0 | 0 | 1250 | 2150 | 0 | 4.92 |
| Mesa Chorio | 0 | 0 | 177000 | 244000 | 0 | 0 | 0 | 0 | 0 | 0 |
| Minthis Resort | 0 | 0 | 840000 | 911250 | 0 | 0 | 0 | 0 | 0 | 0 |
| Pano Paphos | 235000 | 278500 | 320000 | 403182 | 0 | 0 | 0 | 0 | 0 | 0 |
| Pegeia | 0 | 0 | 155000 | 198181 | 650 | 700 | 700 | 791 | 0 | 4.79 |
| Polis | 99000 | 122000 | 145000 | 209281 | 0 | 0 | 600 | 700 | 0 | 4.01 |
| Tala | 0 | 0 | 153000 | 245300 | 0 | 0 | 800 | 800 | 0 | 3.91 |
| Tombs Of The Kings | 135000 | 274406 | 95000 | 509347 | 700 | 700 | 900 | 1133 | 3.06 | 2.67 |
| Town Center Paphos | 150000 | 242385 | 235000 | 409188 | 1350 | 1400 | 1500 | 1760 | 6.93 | 5.16 |
| Tsada | 0 | 0 | 783000 | 862000 | 0 | 0 | 0 | 0 | 0 | 0 |
| Universal | 135000 | 219451 | 150000 | 366317 | 750 | 988 | 750 | 1283 | 5.40 | 4.20 |
| District | Min Sale 1bd | Avg Sale 1bd | Min Sale 2bd | Avg Sale 2bd | Min Rent 1bd | Avg Rent 1bd | Min Rent 2bd | Avg Rent 2bd | Rental Yield 1bd | Rental Yield 2bd |
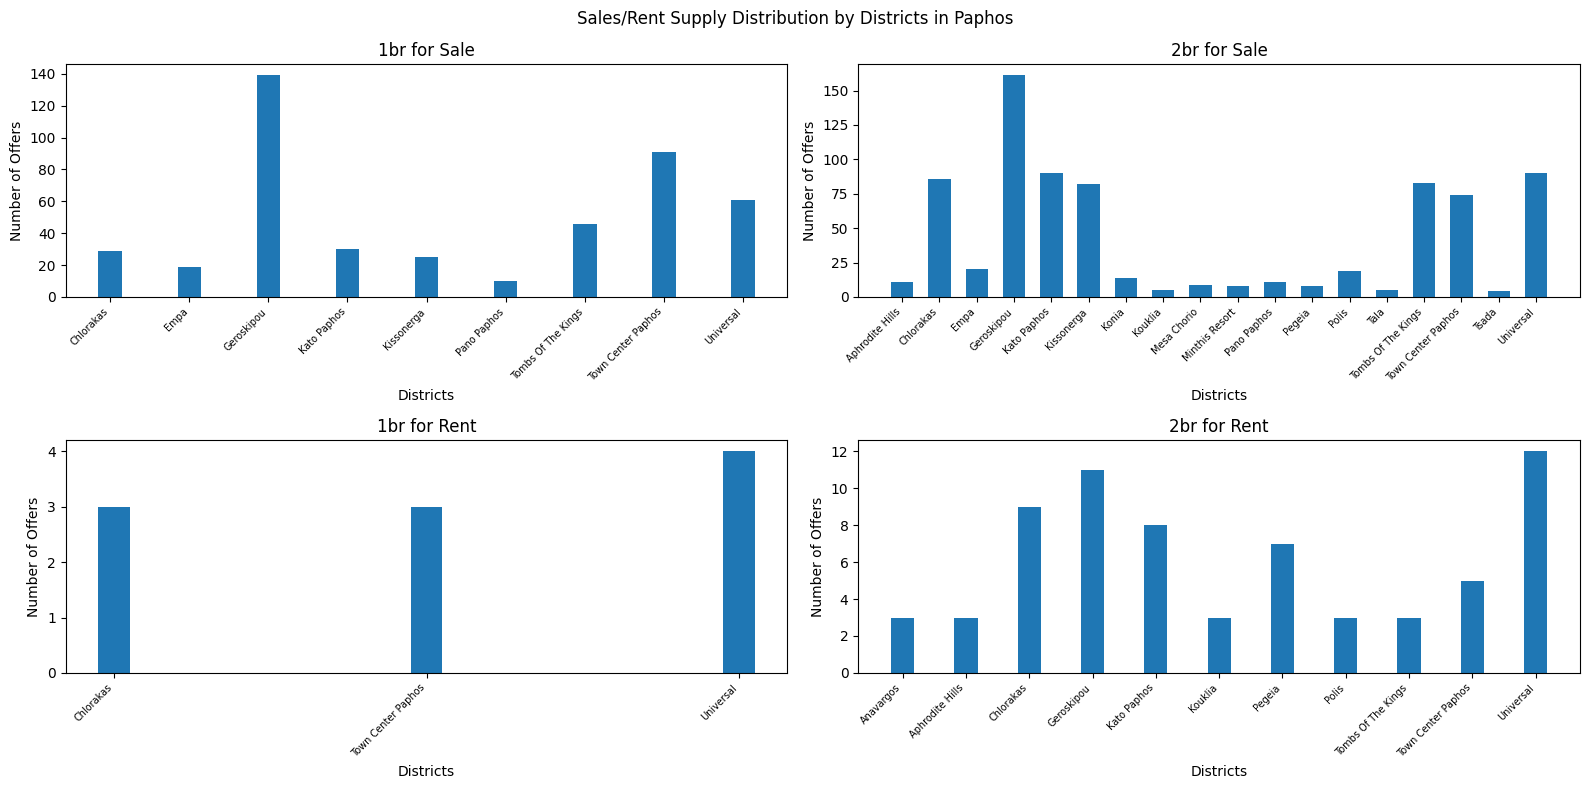
Following is supply distribution in Paphos districts for rent and sale of one—and two-bedroom apartments for the same time period: